

Achieving and maintaining solid performance is essential to assuring that users have the best experience possible when using your web site or services. SiteMinder owners are often questioned by application owners about the impact web agents have on web applications or services. Other than anecdotal references, there is not much information available to SiteMinder owners to properly respond. There is little to no visibility out of the box for this sort of information and as a result customers often ask us, “How can we see if the web agents are waiting for something?”
In this post we will briefly outline how to see the latency associated with web agents , the web site, and the policy server on Windows 2016. In a future post, we will provide the steps for Linux.
For our discussion, we will use the following logical diagram as a reference.

We will use the Windows Resource Monitor to view the latency associated with the target connections in this environment. To collect the required information, we performed the following steps:
- Open Windows Resource Monitor
- On the Overview tab, select the LLAWP and W3WP processes (See image below)
- Navigate to the Network tab and select TCP Connections.
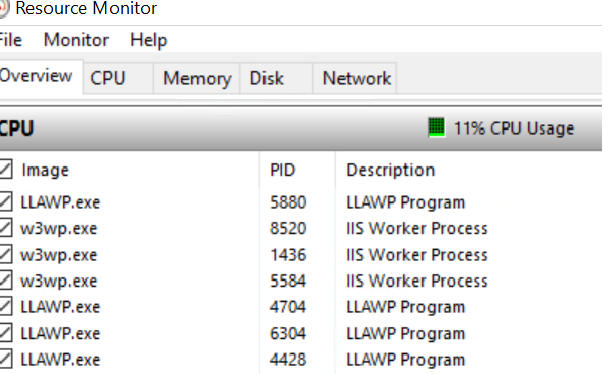
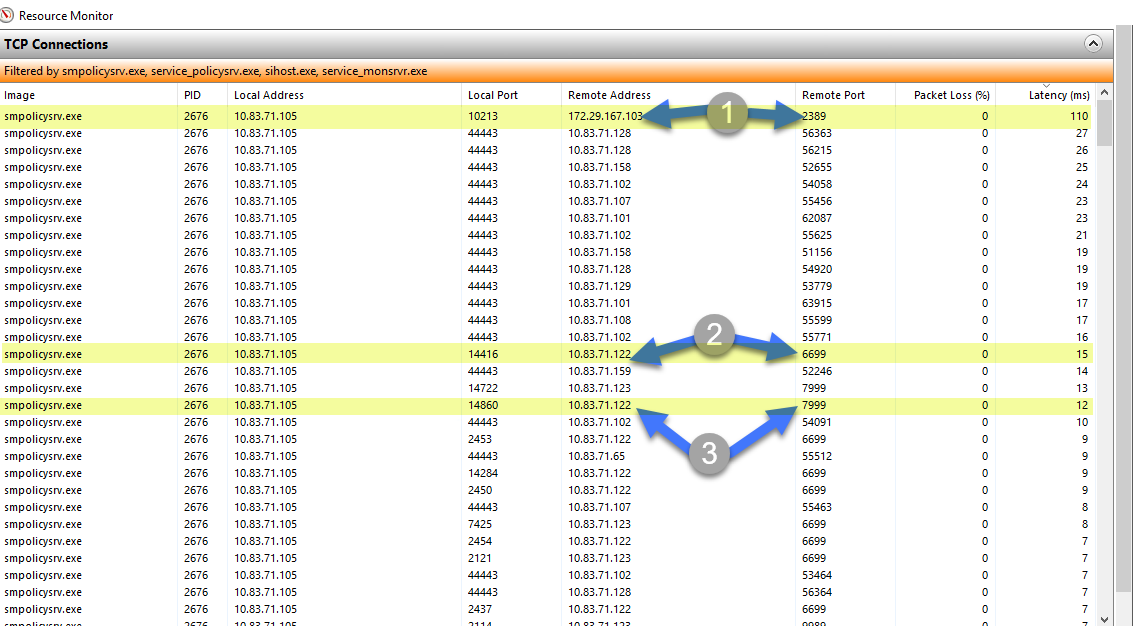
The web server here hosts three distinct web sites (which is why there are three w3wp.exe processes) and all three are protected by SiteMinder. Since the web agent is running within the w3wp.exe process, we need to look at how these processes are interacting with the policy server on port 44443. The image below shows a minimal amount of latency associated with this interaction. The latency depicted is less than 20 milliseconds for all the connections to the policy server. Latency in the resource monitor would represent the communication time and wait time for the agent to establish a connection. (It’s important to note that the lack of latency does not mean there isn’t a downstream issue. It only means there is not an issue communicating with the policy server.) Based on these values, it is safe to say the web agents are not waiting for policy server connections to become available and there is no network congestion in attempting to reach the policy server. The latency between components will change throughout the day, so it is important to monitor these values periodically to determine if latency could be an issue.
Note: This process can be used with the Secure Proxy Server and Access Gateway as well. Instead of selecting the w3wp.exe process, you would select the proxy processes.

We looked at the latency between the web agent and the policy server, but that is only one part of the interaction. It is also important to check the interaction between the web site and client. In many environments, there will be a load balancer, firewall, or SSL accelerator (labeled as LB in the first image) in front of the web sites. This is important because these devices represent the edge of the network and this is the furthest point we can measure latency to the web site. The following image shows the latency between a load balancer (10.83.71.100) and the web sites.

In the first example, we were able to see that there was no significant latency between the web agent and policy server; if there was a significant amount of latency (>300 milliseconds), we would then examine the latency between the policy server and the downstream components (i.e. user store, session store). The following image was taken from the Resource Monitor on a Windows 2016 based policy server.
- This is the connection between the policy server and a directory server at a remote third party data center. As expected, this connection has the most latency, but it is well under the threshold that would cause problems authenticating users. Ideally, if the connection latency is under 500 milliseconds the users wouldn’t have any issues authenticating when the policy server is under load.
- This is the connection between the policy server and a local directory server. As you can see, the latency is 100 milliseconds lower than the remote directory.
- This is the connection between the policy server and the session store. If the connection to the session store has high latency, it will negatively impact the time it takes a user to login. In this example, the reflected 12 milliseconds is not a problem.
Hopefully, the information provided above will help you troubleshoot performance issues you may have with SiteMinder. If you need assistance identifying and correcting a performance issue, please contact SIS.

